National Employability Readiness Mission (NERM)
Powered by Ram Chella | AI Economist & Inventor of Job Safety Index (JSI)
You’re spending billions on skills training.
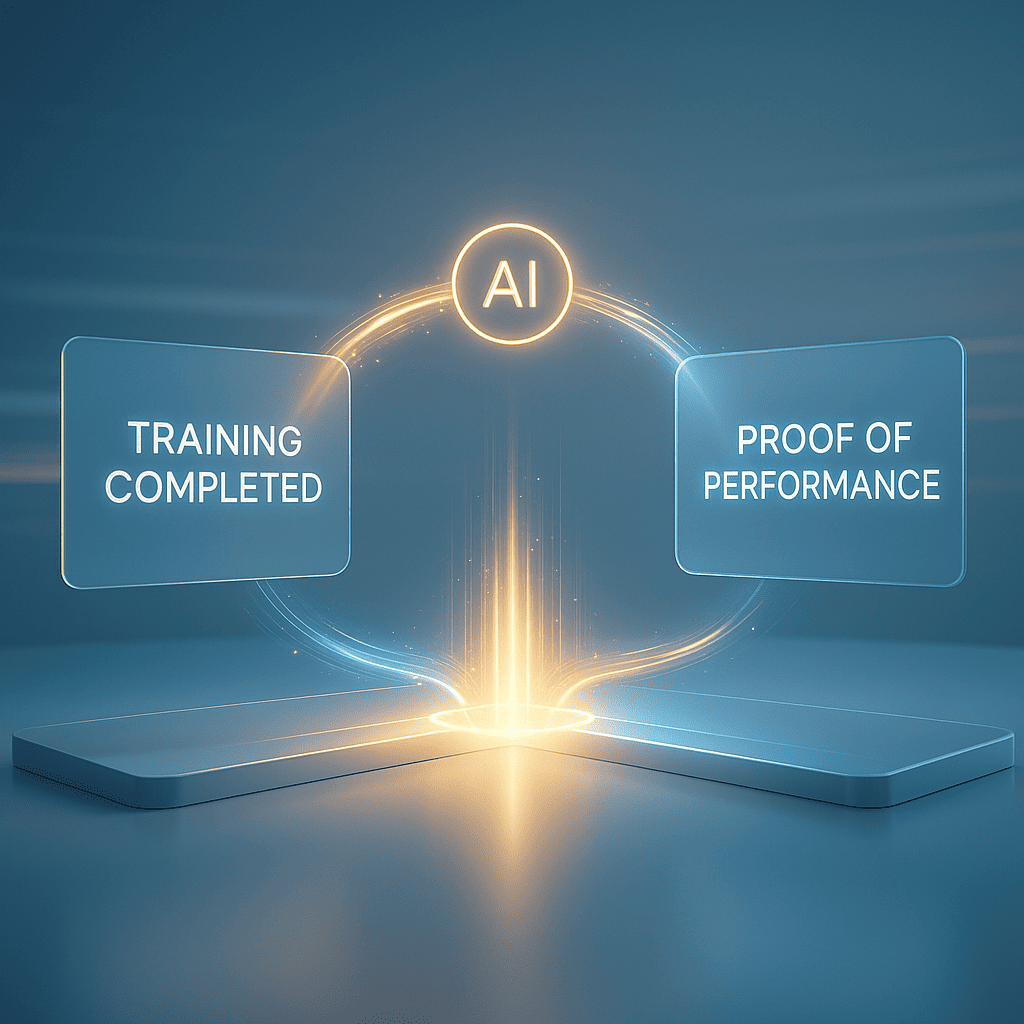
Can you prove it’s working?
Economies are growing while unemployment rises. That’s not a jobs crisis. It’s a readiness crisis.
JSI gives nations the data to measure, map, and fix workforce readiness—before the divide becomes permanent.
The $8 Trillion Workforce Crisis
By 2030, skills mismatch will erase $8.5T in global GDP.
Millions graduate. Millions of roles go unfilled.
6 in 10 graduates aren’t job-ready (employer reported).
Youth unemployment fuels instability, brain drain, and tax loss.
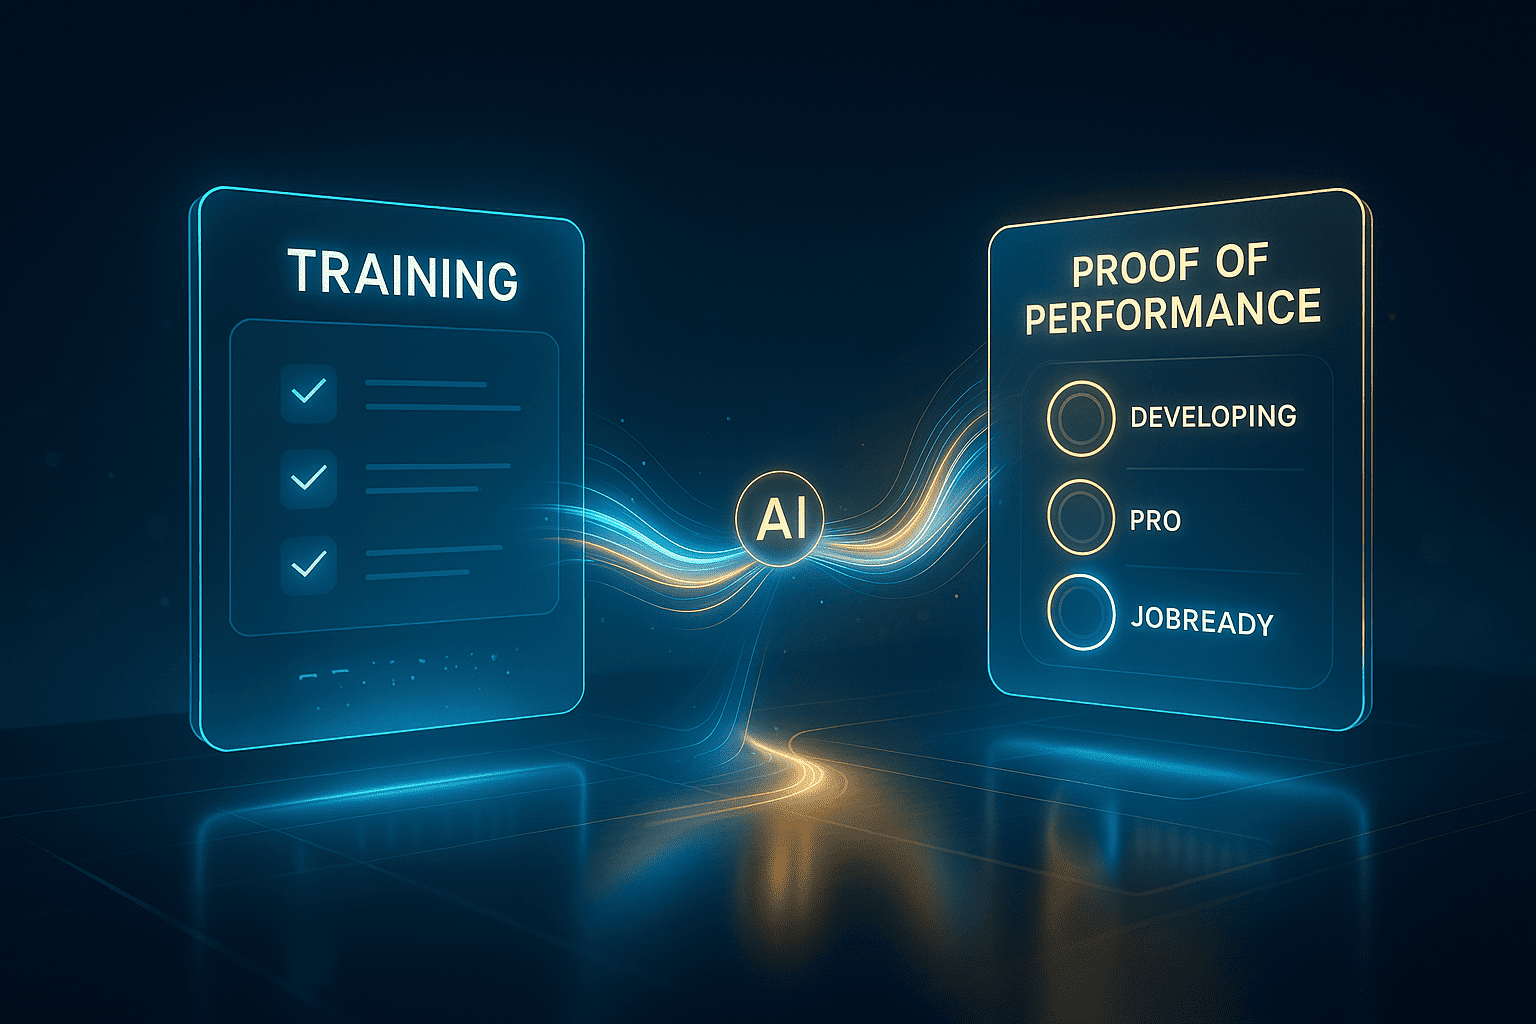
Billions vanish into training programs with no proof of impact.
What’s broken :
Education tests theory, not application.
Employers can’t quantify readiness at scale.
Governments lack real-time employability intelligence.
Policy is reactive, not predictive.
You can’t fix what you can’t measure. Today, no nation measures readiness well.
Introducing the Job Safety Index (JSI)
Think of JSI as your nation’s Readiness GPS. It tells you:
Which regions have the deepest skill gaps.
Which programs improve employability—and which waste money.
Where employer confidence is collapsing—before industries do.
How policy changes move readiness in real time.
Score guide: <50 = crisis, 50–69 = unstable, 70+ = healthy workforce ecosystem.
Why it matters:
the cost of flying blind
Without JSI you cannot answer:
Are national skilling programs creating competence, or just certificates?
Which regions need urgent upskilling?
Where does education fail to convert into employment?
Why are employers importing skills while locals remain jobless?
Which providers deliver job-ready talent vs. waste public funds?
Most decisions still rely on enrollment, unemployment, attendance, and stale surveys. That drives misallocated billions.
JSI answers where to invest, what to invest in, how to measure impact, and when to intervene.
The Solution: National Readiness Intelligence
How it works
Aggregate national data
Education outcomes, employer signals, program performance, labor stats.Compute JSI scores
By region, sector, and demographic.
Example: “Maharashtra JSI 68/100. IT 78 (strong), Manufacturing 52 (weak).”Map employability gaps
Live dashboard with red / yellow / green readiness zones.Recommend interventions
Where to invest, what skills to target, who to partner with.
JobReady National Readiness Engine
(powered by TRIP) converts fragmented data into policy-grade intelligence.
Publish Quarterly National Readiness Reports for transparency.
Global framework, local action
India: The Double Bharat Initiative
India operates two labor markets:
Bharat 1.0 (urban, skilled) and Bharat 2.0 (rural, semi-skilled).
The divide is widening.
Double Bharat goals
Benchmark both “Bharats” with JSI.
Direct investment to high-ROI regions and skills.
Align education, industry, and policy around measurable employability.
Close the readiness gap before it becomes permanent
JSI is global by design and local in execution. We launch country councils with policymakers, HR leaders, economists, and educators to co-create reforms.
How to participate (and what you get)
1) Download the JSI Policy Playbook
Framework, data model, pilot case briefs.2) Join your National Employability Council
Get early access to quarterly JSI Reports, invitations to policy roundtables, and co-authorship credit on publications.3) Optional: Run a Readiness Pilot
Deploy JSI metrics in a state, sector, or institution. Receive platform access, onboarding, and recognition in the National Readiness Report.
4) Contribute anonymized data
Hiring trends, program outcomes, readiness scores. Data contributors are acknowledged in quarterly reports.The Data Engine behind JSI
TRIP Readiness Assessments: convert training outcomes into Readiness Scores.
APIs & Secure Ingestion: institutions, ministries, industry bodies.
Scoring model: four matrices, equal weights (25% each) with calibration for sectoral sensitivity.
Outputs: Readiness Scores, Skill-Gap Maps, Intervention ROI, Quarterly/Annual Reports.
Security & governance: API-first, audit logs, data minimization, GDPR-aligned.
Why now
AI is automating low-skill work and making unproven learning worthless.
Nations that measure and fix readiness first will attract investment, retain talent, and grow faster.
In five years there will be two economies:
Data-driven workforce nations (prove readiness, win capital)
Certificate nations (produce degrees no one hires)
Which will yours be?
See how policymakers use JSI to direct investment
and prove impact
In 20 minutes we’ll show:
✓ A live JSI dashboard (region/sector scores)
✓ How readiness gaps are flagged in real time
✓ How to publish a Quarterly National Readiness Report
✓ How councils run pilots and feed data back


